An introduction and overview of the D3.js data visualisation library.
D3 is a JavaScript library used to create bespoke, interactive charts and maps on the web.
Most charting libraries (such as Chart.js and Highcharts) provide ready made charts whereas D3 consists of building blocks with which custom charts or maps can be constructed.
D3's approach is much lower level than other charting libraries. Creating a bar chart with Chart.js is just a few lines of code.
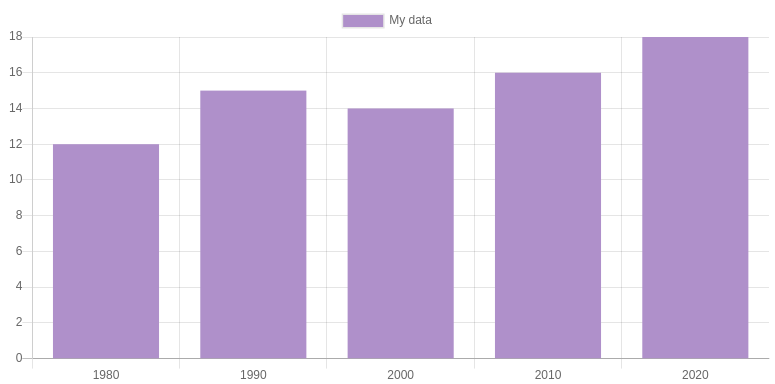
Creating a similar chart with D3 is more involved and requires experience with JavaScript, HTML, SVG and CSS.
If you require a standard bar, line or pie chart you should consider a library such as Chart.js. However if you require bespoke charts or have very precise needs then D3 should be considered.
D3's features include:
- data-driven modification of HTML and SVG elements
- scale functions
- loading and transforming data (e.g. CSV data)
- helpers for generating complex charts such as treemaps, packed circles and networks
- a powerful transition system for animating between different chart states
- powerful user interaction support, including panning, zooming and dragging
Let's look at each of these in turn.
Data-driven modification of HTML/SVG elements
D3 lets you add, remove and modify HTML and SVG elements in a data-driven fashion.
For example, suppose you have an array of numbers. You can ask D3 to create an SVG circle for each array element.
Furthermore you can ask D3 to set the radius of each circle according to each array value. This is known as data binding (or joining) and is a cornerstone of D3.
We cover these aspects in the Selections, Joins and Enter/Exit chapters.
Scale functions
Scale functions take an input (usually a number, string or date) and return a value (usually a number or a string).
They’re typically used to transform (or 'map') data values into visual values (such as position, length and colour).
For example, they can be used to transform your data values into positions on the screen.
Scale functions are covered in the Scale functions chapter.
Loading and transforming data
One of the most common data formats is comma separated value (CSV). This format is easily exportable by spreadsheets and databases, is human readable and is relatively compact.
D3 can help you request CSV files from a given URL and to convert the CSV file into a JavaScript array. This makes working with real data much easier.
We cover loading CSV files in the Requests chapter.
Complex chart creation
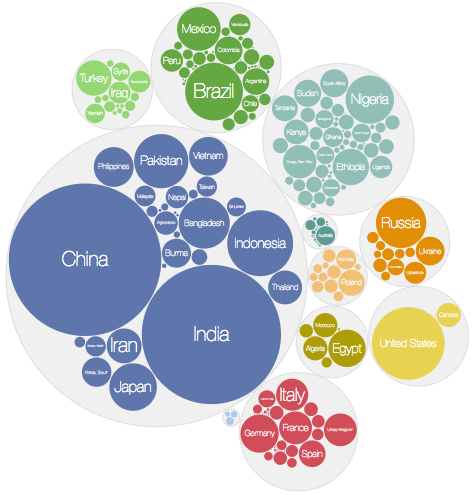
D3 provides building blocks for creating more complex charts such as treemaps, packed circles, network graphs and geographic maps.
For example, to create a packed circle chart you can use D3's pack layout which, given a tree data structure, appends position and size values to each item in the tree.
You can then use a D3 data join to create an SVG circle for each tree item. Each circle can then be positioned and sized according to the values calculated by the pack layout.
We cover the creation of more complex shapes and charts in the Shapes, Layouts, Force and Geographic chapters.
Transitions
D3 transitions let you smoothly animate between different chart states. For instance, if you have a scatter plot and the user selects a different indicator for one of the axes, the points will smoothly animate to their new positions.
As well as being visually appealing, the transition helps you track the movement of the points.
D3's transition system is powerful (it lets you control how elements first appear, how they move to new states, and how they exit the page) and is relatively simple to use.
We cover D3 transitions in the Transitions chapter.
Advanced interaction support
When the entire contents of a chart or map can't comfortably fit within a given window, user interaction such as panning and zooming can help.
D3 can help you add panning and zooming to a chart, saving you a lot of work (especially checking it works on all platforms).
We cover advanced interactions in the Interaction chapter.
Where next?
Unless you're here for a specific topic, I suggest starting with the Selections, Joins, Enter/exit and Scales chapters.
Once you're comfortable with those, browse through the remaining chapters and choose whichever appeals the most!