
This article shows how to join an array of data to a D3 selection. We cover how to create a data join, how to update a data join, how to join an array of objects and key functions.
A data join creates a correspondence between an array of data and a selection of HTML or SVG elements.
Joining an array to HTML/SVG elements means that:
- HTML (or SVG) elements are added or removed such that each array element has a corresponding HTML (or SVG) element
- each HTML/SVG element may be positioned, sized and styled according to the value of its corresponding array element
For example, suppose we've an array of five numbers which we'd like to join to circle elements:
[ 40, 10, 20, 60, 30 ]Each time D3 performs the join it adds or removes circle elements so that each array element has a corresponding circle element.
D3 can also update the position and radius of each circle (and any other attributes or style) based on the value of the corresponding array element.
For example, the radius of each circle can be set to half the value of the corresponding array value. This results in the first circle having a radius of 20, the second a radius of 5 and so on:
Prior to version 5 of D3, data joins were not all that easy to learn (you had to learn about enter, exit and update). Fortunately, for versions 5 and up, data joins are much easier!
How to create a data join
The general pattern for creating a data join is:
select(container)
  .selectAll(element-type)
  .data(array)
  .join(element-type);
where:
containeris a CSS selector string that specifies a single element that'll contain the joined HTML/SVG elementselement-typeis a string describing the type of element you’re joining (e.g. ‘div' or 'circle')arrayis the name of the array you’re joining
Typically four methods are used in a data join:
.selectdefines the element that'll act as a container (or parent) to the joined HTML/SVG elements.selectAlldefines the type of element that'll be joined to each array element.datadefines the array that's being joined.joinperforms the join. This is where HTML or SVG elements are added and removed
Example
Given an array:
let myData = [40, 10, 20, 60, 30];and an svg element containing a g element:
<svg>
  <g class="chart">
  </g>
</svg>
join myData to circle elements using:
let myData = [40, 10, 20, 60, 30];

select('.chart')
  .selectAll('circle')
  .data(myData)
  .join('circle');
In this example:
- the container is the
gelement - the element type is
circle - the array being joined is
myData
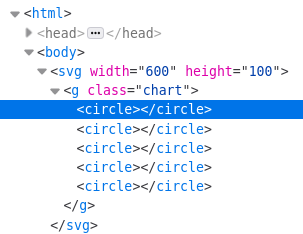
Running this code results in 5 circles being created:
<svg>
  <g class="chart">
    <circle></circle>
    <circle></circle>
    <circle></circle>
    <circle></circle>
    <circle></circle>
  </g>
</svg>
You can't see any circles because each radius is zero. However if you inspect and expand the SVG element (right click on the SVG element which has been coloured light pink and select Inspect) you'll see five circle elements have been added:
In the CodePen example you can try adding elements to the array and you'll see that the data join ensures there are as many circles as array elements.
Updating the joined elements
Joined HTML or SVG elements may be updated using the .style, .attr and .text methods that were covered in the selections chapter.
For example you can set the center, radius and colour of every circle using:
let myData = [40, 10, 20, 60, 30];

select('.chart')
  .selectAll('circle')
  .data(myData)
  .join('circle')
  .attr('cx', 200)
  .attr('cy', 50)
  .attr('r', 40)
  .style('fill', 'orange');
You only see one circle because all five circles share the same position and size.
Data driven updates
If a function is passed into .attr or .style you can update the HTML/SVG elements in a data-driven manner.
The function is called for each element in the selection. It takes two parameters, typically named d and i.
The first parameter (d) represents the corresponding array element (or the 'joined value'). The second parameter i represents the index of the element within the selection.
The return value of the function is used to set the attribute or style value.
Let's pass a function into the first .attr:
let myData = [40, 10, 20, 60, 30];

select('.chart')
  .selectAll('circle')
  .data(myData)
  .join('circle')
  .attr('cx', function(d, i) {
    return i * 100;
  })
  .attr('cy', 50)
  .attr('r', 40)
  .style('fill', 'orange');
This tells D3 to set each circle's cx attribute to i * 100. i is the index within the selection, so the first circle will be positioned at 0, the next at 100 and so on:
Now let's set r according to the joined value:
let myData = [40, 10, 20, 60, 30];

select('.chart')
  .selectAll('circle')
  .data(myData)
  .join('circle')
  .attr('cx', function(d, i) {
    return i * 100;
  })
  .attr('cy', 50)
  .attr('r', function(d) {
    return 0.5 * d;
  })
  .style('fill', 'orange');
(The first circle is clipped because it's cx attribute is zero.)
You can put any amount of logic within the functions that are passed into .attr and .style. For example, let's colour the circle if its joined value is greater than 30:
let myData = [40, 10, 20, 60, 30];

select('.chart')
  .selectAll('circle')
  .data(myData)
  .join('circle')
  .attr('cx', function(d, i) {
    return i * 100;
  })
  .attr('cy', 50)
  .attr('r', function(d) {
    return 0.5 * d;
  })
  .style('fill', function(d) {
    return d > 30 ? 'orange' : '#eee';
  });
Joining arrays of objects
When building data visualisations with D3 arrays of objects (rather than numbers) are typically joined to selections. For example:
let cities = [
  { name: 'London', population: 8674000},
  { name: 'New York', population: 8406000},
  { name: 'Sydney', population: 4293000},
  { name: 'Paris', population: 2244000},
  { name: 'Beijing', population: 11510000}
];
You can join an array of objects in the same manner as before. However, when a function is passed into .attr or .style, the d parameter is an object. This means you need to reference a property of that object.
For example:
  ...
  .attr('r', function(d) {
    return 0.0001 * d.population;
  })
  ...
Here's a full example where cities is joined to circle elements:
let cities = [
  { name: 'London', population: 8674000},
  { name: 'New York', population: 8406000},
  { name: 'Sydney', population: 4293000},
  { name: 'Paris', population: 2244000},
  { name: 'Beijing', population: 11510000}
];

select('.chart')
  .selectAll('circle')
  .data(cities)
  .join('circle')
  .attr('cx', function(d, i) {
    return i * 100;
  })
  .attr('cy', 50)
  .attr('r', function(d) {
    let scaleFactor = 0.00004;
    return scaleFactor * d.population;
  })
  .style('fill', '#aaa');
Each circle is sized according to the city's population. (Note that it's better practice to set the area, rather than the radius, of a circle proportionally to a data value.)
You can build a simple bar chart using the above techniques. Instead of joining circle elements, let's join rect and text elements:
let cities = [
  { name: 'London', population: 8674000},
  { name: 'New York', population: 8406000},
  { name: 'Sydney', population: 4293000},
  { name: 'Paris', population: 2244000},
  { name: 'Beijing', population: 11510000}
];

// Join cities to rect elements and modify height, width and position
select('.bars')
  .selectAll('rect')
  .data(cities)
  .join('rect')
  .attr('height', 19)
  .attr('width', function(d) {
    let scaleFactor = 0.00004;
    return d.population * scaleFactor;
  })
  .attr('y', function(d, i) {
    return i * 20;
  })

// Join cities to text elements and modify content and position
select('.labels')
  .selectAll('text')
  .data(cities)
  .join('text')
  .attr('y', function(d, i) {
    return i * 20 + 13;
  })
  .text(function(d) {
    return d.name;
  });
How about that? We've just built a simple bar chart using D3!
(This example relies on extra code in index.html and style.css. Open the CodePen example to see the full example.)
Update functions
If your data array changes you need to perform the join again. (Unlike some frameworks such as Vue.js, D3 doesn't automatically do this for you.)
Therefore we usually put the join code in a function. Whenever the data changes, we call this function.
For example:
let myData = [40, 10, 20, 60, 30];

function update(data) {
  select('.chart')
    .selectAll('circle')
    .data(data)
    .join('circle')
    .attr('cx', function(d, i) {
      return i * 100;
    })
    .attr('cy', 50)
    .attr('r', function(d) {
      return 0.5 * d;
    })
    .style('fill', function(d) {
      return d > 30 ? 'orange' : '#eee';
    });
}

update(myData);
We pass the data array into update. Each time update is called the join is performed.
The data doesn't ever change in the previous example, so let's add a button that when clicked gets some randomised data and calls update:
function getData() {
  let data = [];
  let numItems = Math.ceil(Math.random() * 5);

  for(let i=0; i<numItems; i++) {
    data.push(Math.random() * 60);
  }

  return data;
}

function update(data) {
  select('.chart')
    .selectAll('circle')
    .data(data)
    .join('circle')
    .attr('cx', function(d, i) {
      return i * 100;
    })
    .attr('cy', 50)
    .attr('r', function(d) {
      return 0.5 * d;
    })
    .style('fill', function(d) {
      return d > 30 ? 'orange' : '#eee';
    });
}

function updateAll() {
  let myData = getData();
  update(myData);
}

updateAll();

select("button")
  .on("click", updateAll);
getData returns a random length array containing random values. A button element has been added to index.html. The last two lines add an event handler updateAll to this button. updateAll calls getData and then calls update to perform the join.
Each time the button is clicked the data updates and the circles update accordingly.
Key functions
When D3 performs a data join it joins the first array element to the first element in the selection, the second array element to the second element in the selection and so on.
However if the data is re-joined and it has changed order, the array elements will be joined to different DOM elements. This can cause unwanted behaviour when transitions are used.
You can ensure each array element remains joined to the same HTML/SVG element by passing a key function into the .data method. The key function should return a unique id value for each array element.
Look at this example where an array ['Z'] is joined to div elements. Each time the button is clicked a new letter is added to the start of the array:
When 'Insert element' is clicked a new div element is added to the end of the row. However, the text of each existing div changes.
If a key function is used, each letter will stay joined to the same div element and the elements shuffle along in the expected manner:
Debugging
When D3 performs a data join it adds an attribute data to each DOM element in the selection and assigns the joined data to it.
You can inspect this in Google Chrome by right clicking on an element, choosing 'Inspect' and typing:
$0.__data__in the debug console. ($0 represents the element that's being inspected.)
Being able to check the joined data in this manner is particularly useful when debugging because it lets us check whether our data join is behaving as expected.